Traces, messages and comparing
1. Introduction
This part is about how Analyze works, what you can see and what buttons to press. This part is specific for the traces created in Analyze. This is the raw information, saved in the database via the wiretaps in your interfaces.
To explain how things work, this page uses some sample data and a sample interface to handle that data.
After that you will see what it looks like in the Analyze application and what you can do with it.
|
The examples are for Linux machines. To run them on a Windows Server platform, change the directory settings in the File Pickup and File Drop, then deploy and you are ready to go. |
2. Building up the sample data
Requirements
-
XML file with customers: Download the customer XML file
-
The Analyze documentation interface: Download the example interface
cust41.xml
This file contains 41 customers.
<?xml version="1.0" encoding="UTF-8" ?>
<Customers>
    <Customer>
        <first_name>Edward</first_name>
        <last_name>Evans</last_name>
        <full_name>Edward Evans</full_name>
        <phone>503-310-3671</phone>
        <address>1 A ST</address>
        <city>JOHNSTON</city>
    </Customer>
    <Customer>
        <first_name>Sarah</first_name>
        <last_name>Mitchell</last_name>
        <full_name>Sarah Mitchell</full_name>
        <phone>212-555-0142</phone>
        <address>24 Oak Street</address>
        <city>NEW YORK</city>
    </Customer>
    <Customer>
        <first_name>Michael</first_name>
        <last_name>Thompson</last_name>
        <full_name>Michael Thompson</full_name>
        <phone>312-555-0187</phone>
        <address>87 Lincoln Avenue</address>
        <city>CHICAGO</city>
    </Customer>
    <Customer>
        <first_name>Jessica</first_name>
        <last_name>Anderson</last_name>
        <full_name>Jessica Anderson</full_name>
        <phone>415-555-0234</phone>
        <address>142 Pine Road</address>
        <city>SAN FRANCISCO</city>
    </Customer>
    <Customer>
        <first_name>David</first_name>
        <last_name>Wilson</last_name>
        <full_name>David Wilson</full_name>
        <phone>617-555-0369</phone>
        <address>56 Beacon Street</address>
        <city>BOSTON</city>
    </Customer>
    <Customer>
        <first_name>Emily</first_name>
        <last_name>Roberts</last_name>
        <full_name>Emily Roberts</full_name>
        <phone>305-555-0418</phone>
        <address>903 Coral Way</address>
        <city>MIAMI</city>
    </Customer>
    .
    .
    .
<Customers>
importCustomers flow
The flow used in this example is the importCustomers flow.
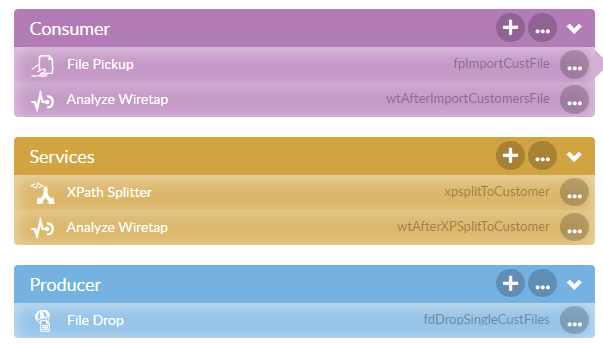
This flow takes the cust41.xml file and splits it into single-customer XML
files.
Drop the file cust41.xml in the /tmp/analyze/customersIN directory.
3. Analyze trace data
3.1. Trace overview
Once your data has been processed, open the Analyze trace overview screen.
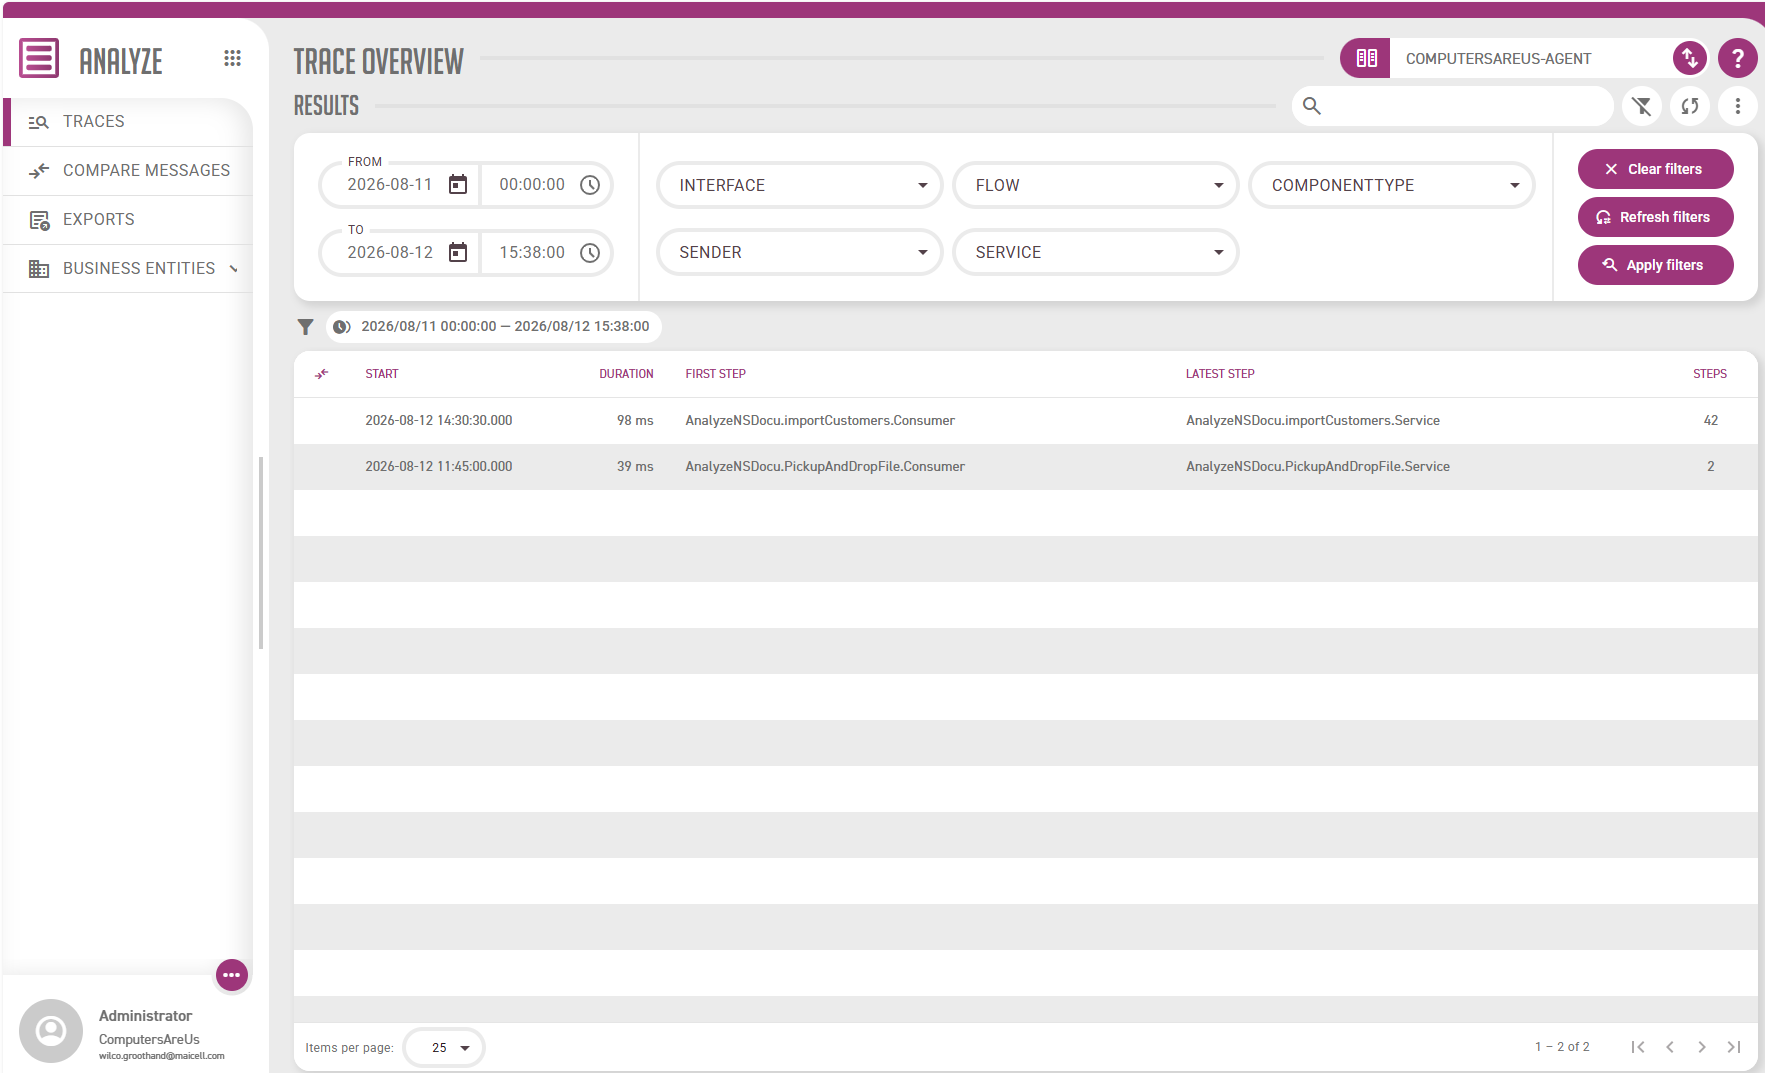
Look at the first row: it shows 42 steps in the trace. This means that the flow consists of 42 wiretap registrations before coming to an end. This is correct: one registration comes from the Analyze Wiretap placed after the file read, and the other 41 come from the Analyze Wiretap placed after the XPath Splitter, once per split record.
Now go to the detail page to see what is in there.
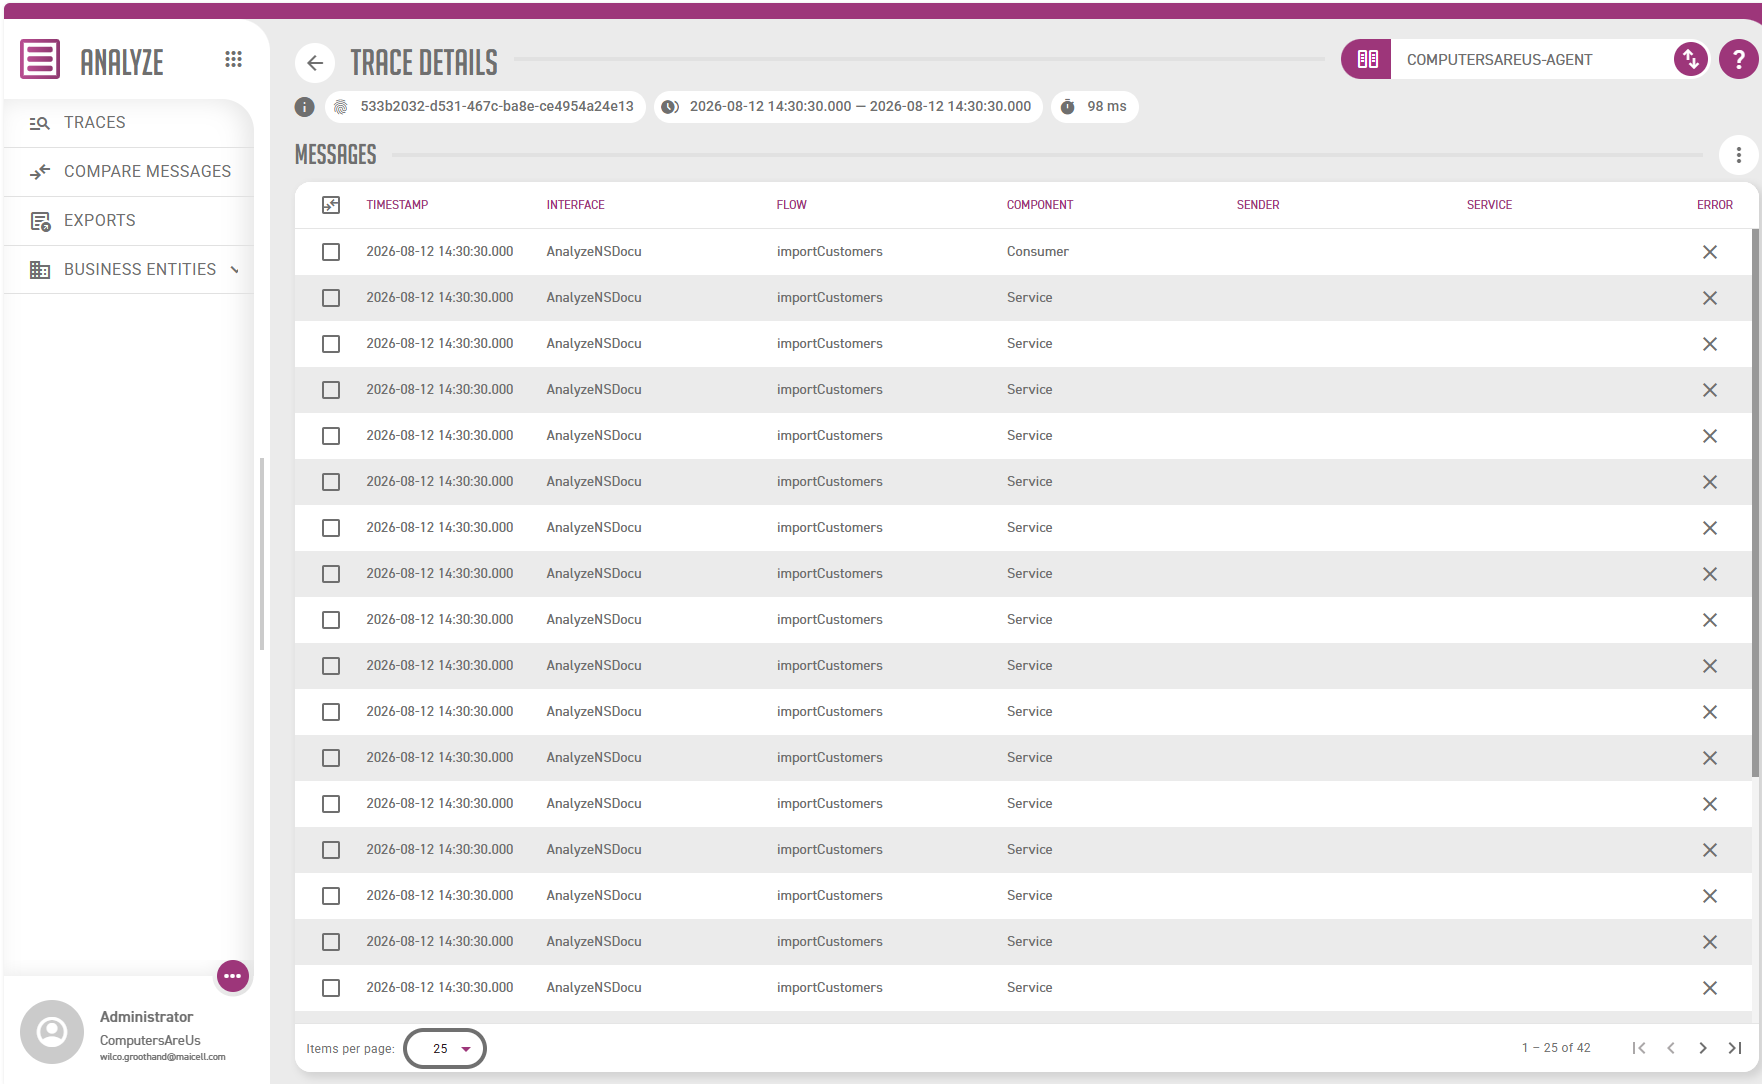
Here you see all the messages from the specific trace. At the top of the screen you see some information about this trace.

| Field | Description |
|---|---|
Correlation ID |
This is the correlation ID of the trace. All the messages which belong to this trace have this correlation ID. |
Timestamp |
These are the start and end time of the trace. So the first wiretap registration and the last wiretap registration. Keep in mind that it is not the real start and end time registration. It depends on how you integrated the wiretaps in your interface. |
Duration |
This is the duration time of the trace in milliseconds. |
Under the trace information you see the messages saved for you via your wiretaps.
| Field | Description |
|---|---|
|
Selected to compare |
Interface |
The name of the interface the wiretap executed |
Flow |
The name of the flow the wiretap executed |
Component |
Type of the component (Consumer, Service or Producer) |
Sender |
This field you can add in the wiretap via Constructor |
Service |
This field you can add in the wiretap via Constructor |
Error |
If this is an error, you will see it here |

3.2. Message detail overview
You can open one of these messages to see what is inside it. Double click the Consumer message (the first) in your list, and the message detail screen opens.
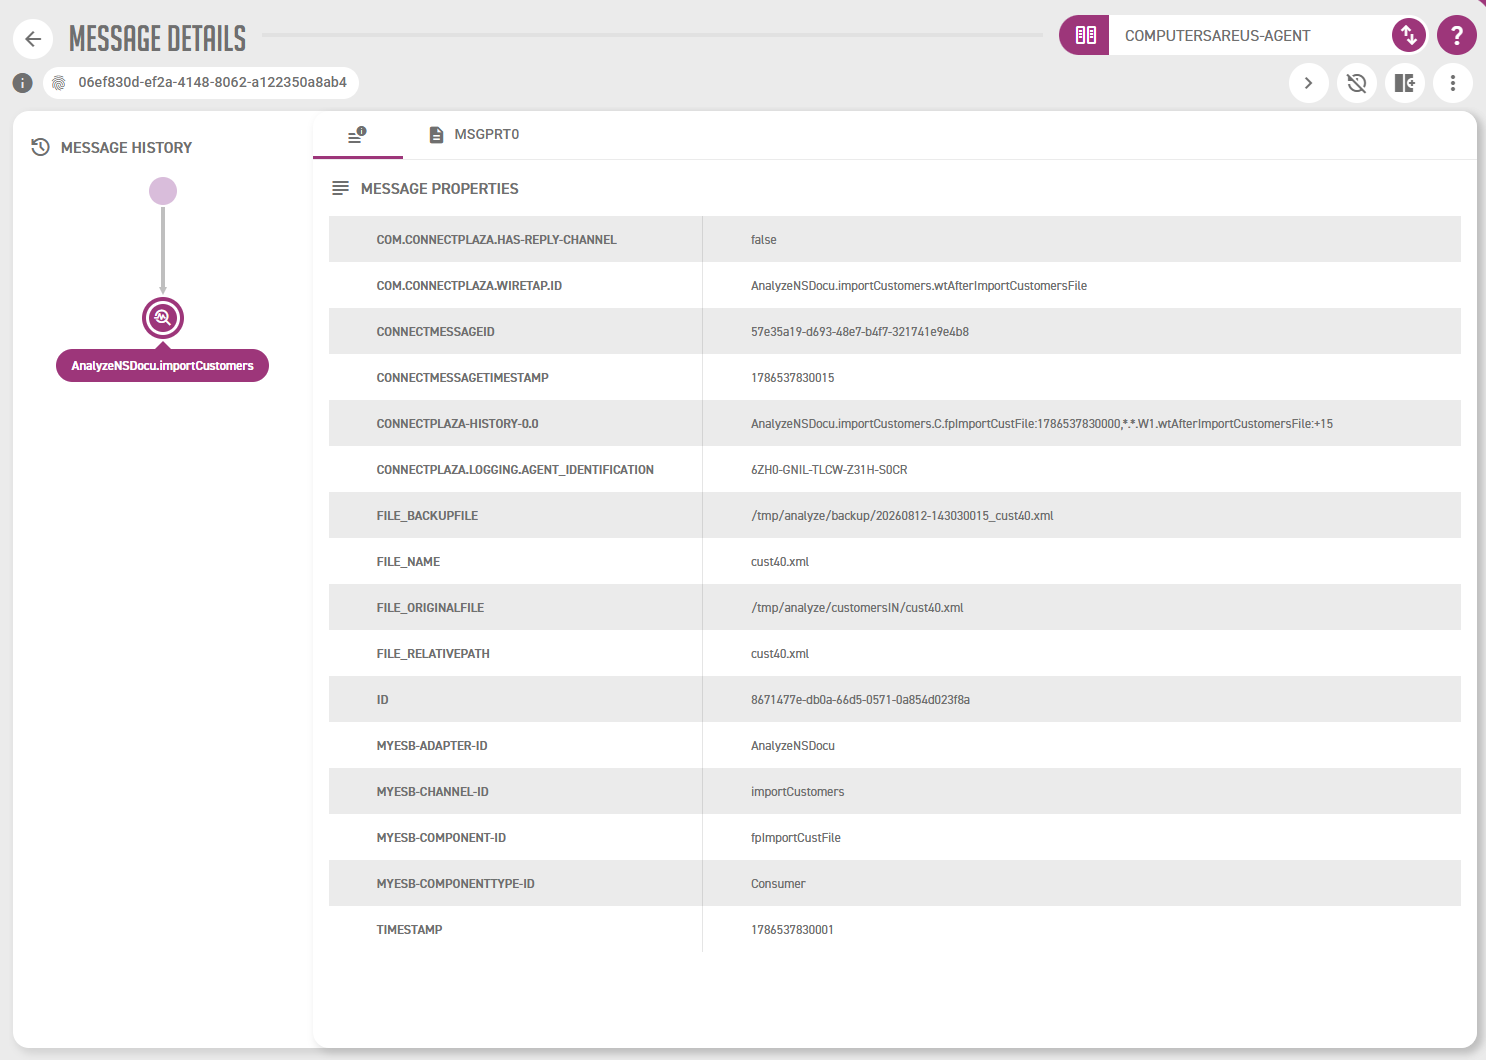
This screen shows the information for this message as well.

You see the correlation ID of the message; every message has a unique correlation ID.
Further down the message detail screen you see the data. On the left is the Message History, and on the right you see the different parts of the message: the properties and the message parts. All message parts are shown in separate tabs.
3.3. Message history
Take a closer look at the message history.
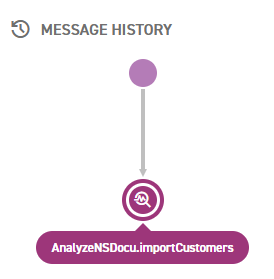
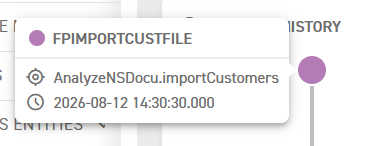
This is the first message, the consumer part. Remember the interface: a wiretap was added in the consumer part of the flow, and this is what you see here. The first purple ball is the File Pickup. If you click the purple ball, you get some information about this component.
You can go back to the message detail overview by clicking  . Select the second message, which is a service message, and check the Message history again.
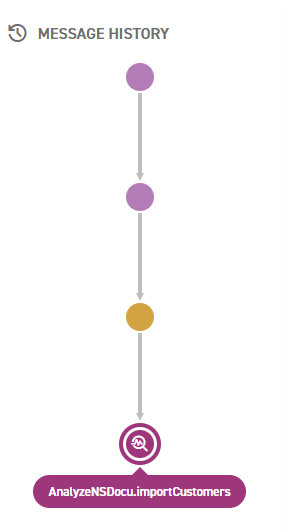
You now see more information: all the steps the message passed are visible. Only the Analyze Wiretap steps store a message in Analyze itself.
3.4. Message properties
Now look at the message itself.
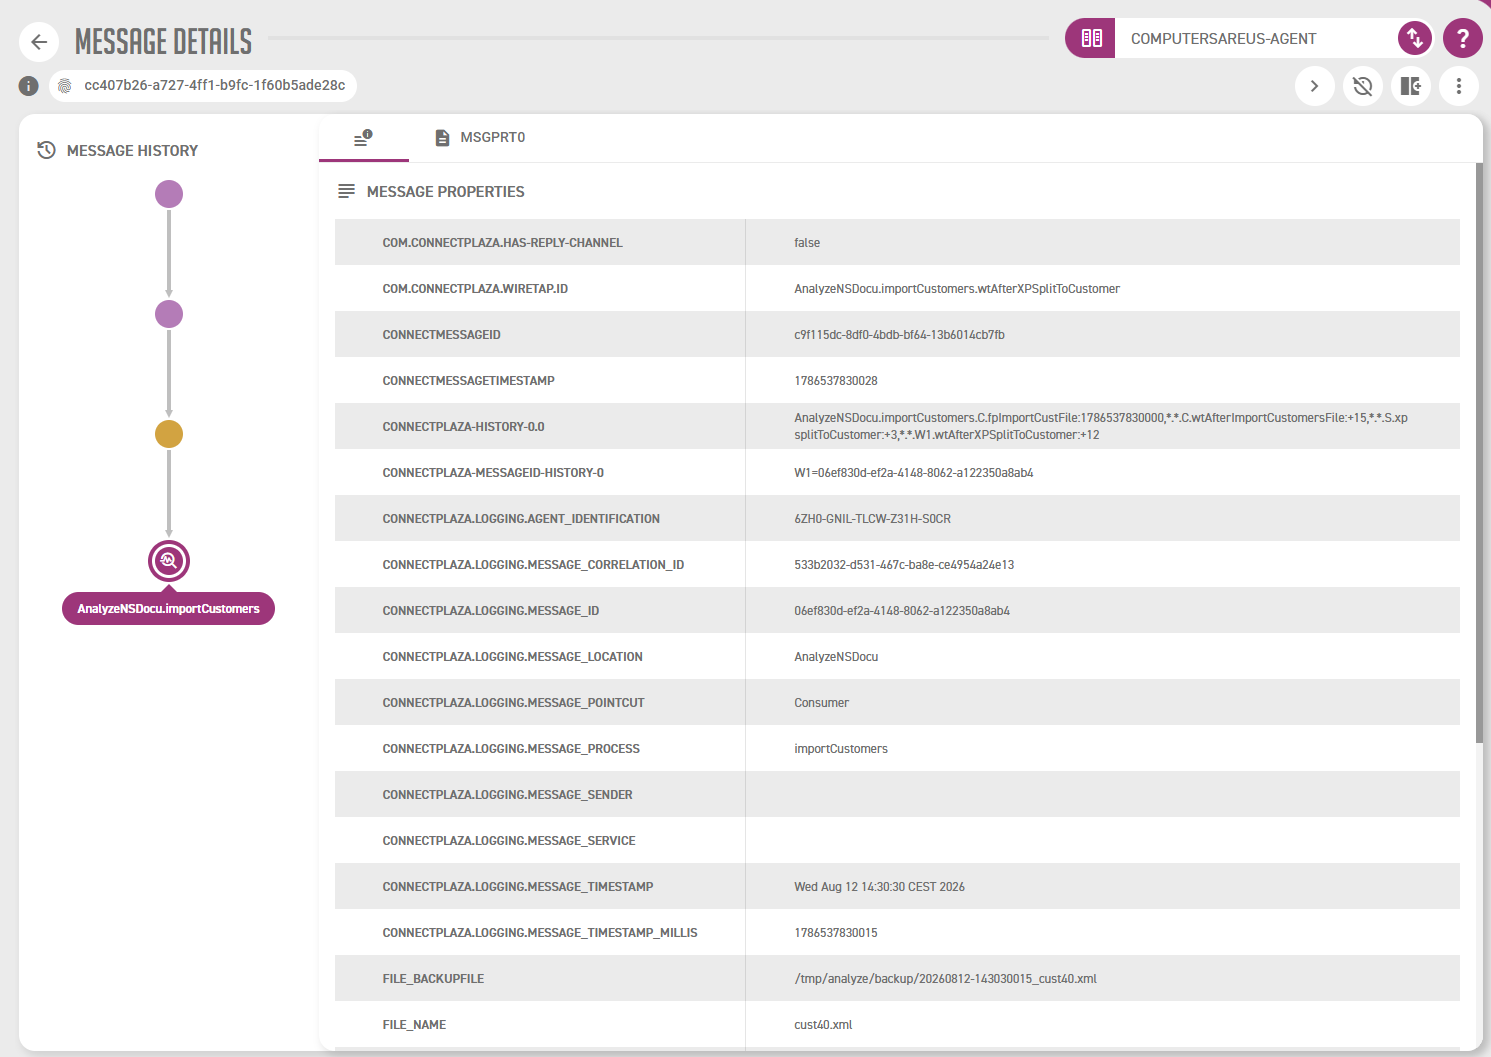
There are two tabs in this screen. The first is the message properties tab:  . This tab gives you an overview of all the properties saved with the message.
3.5. Message parts / Message part properties
The second tab, and the third, fourth and so on, holds the message parts. The name of each part is the name of its tab, in this case MSGPRT0. Open the tab to see what the message part contains.
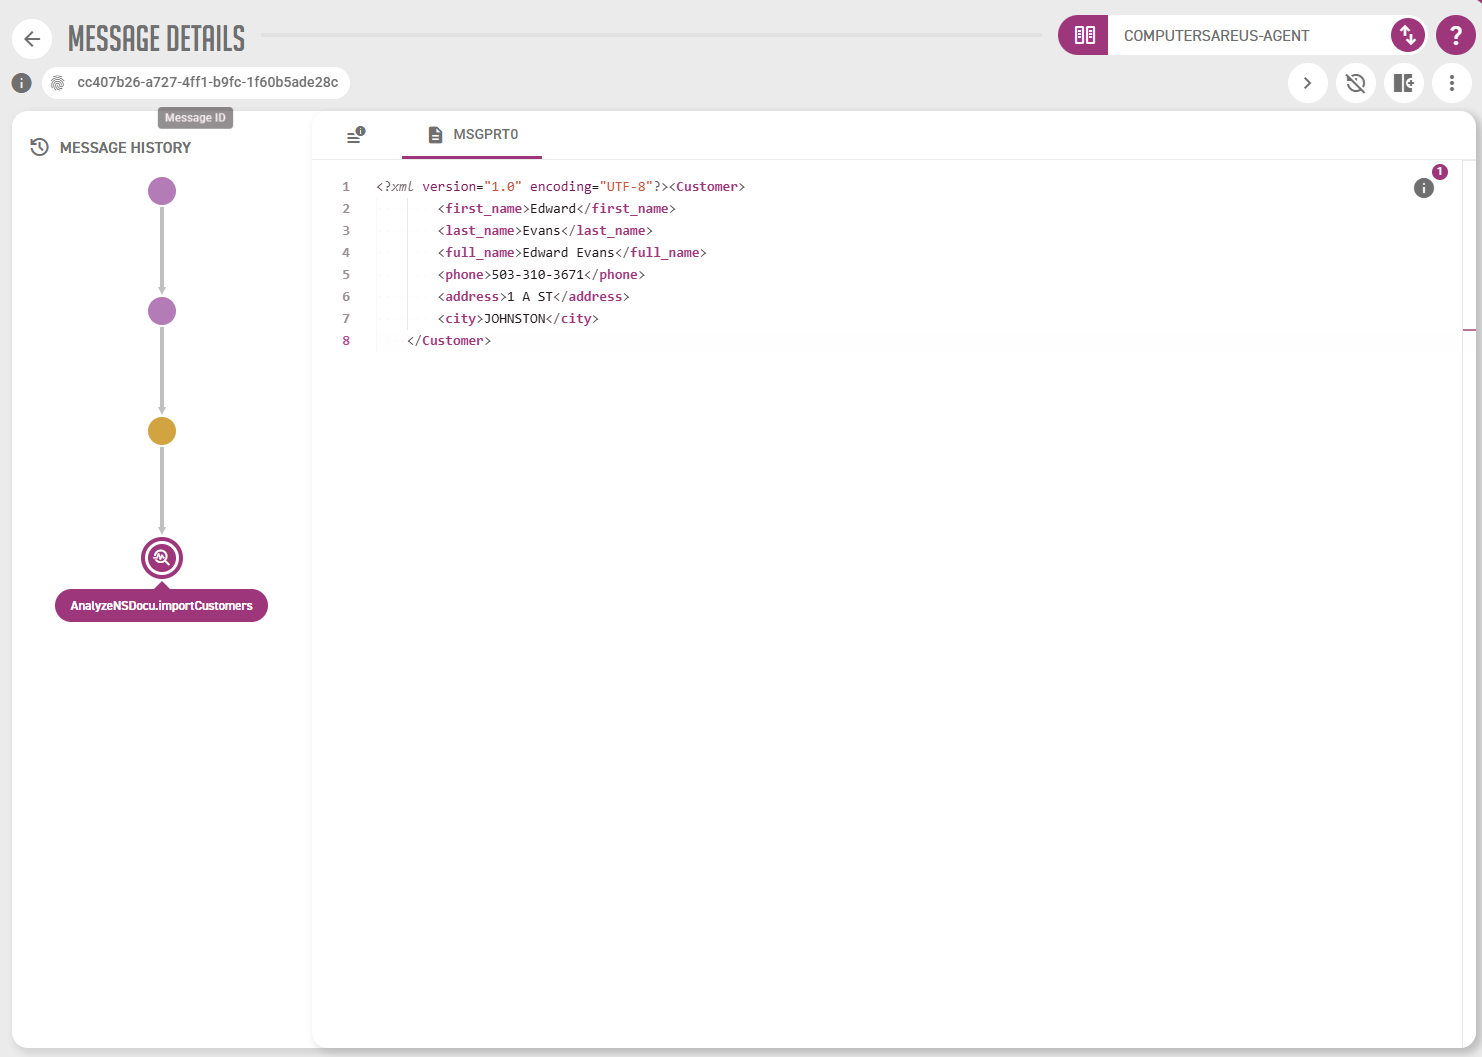
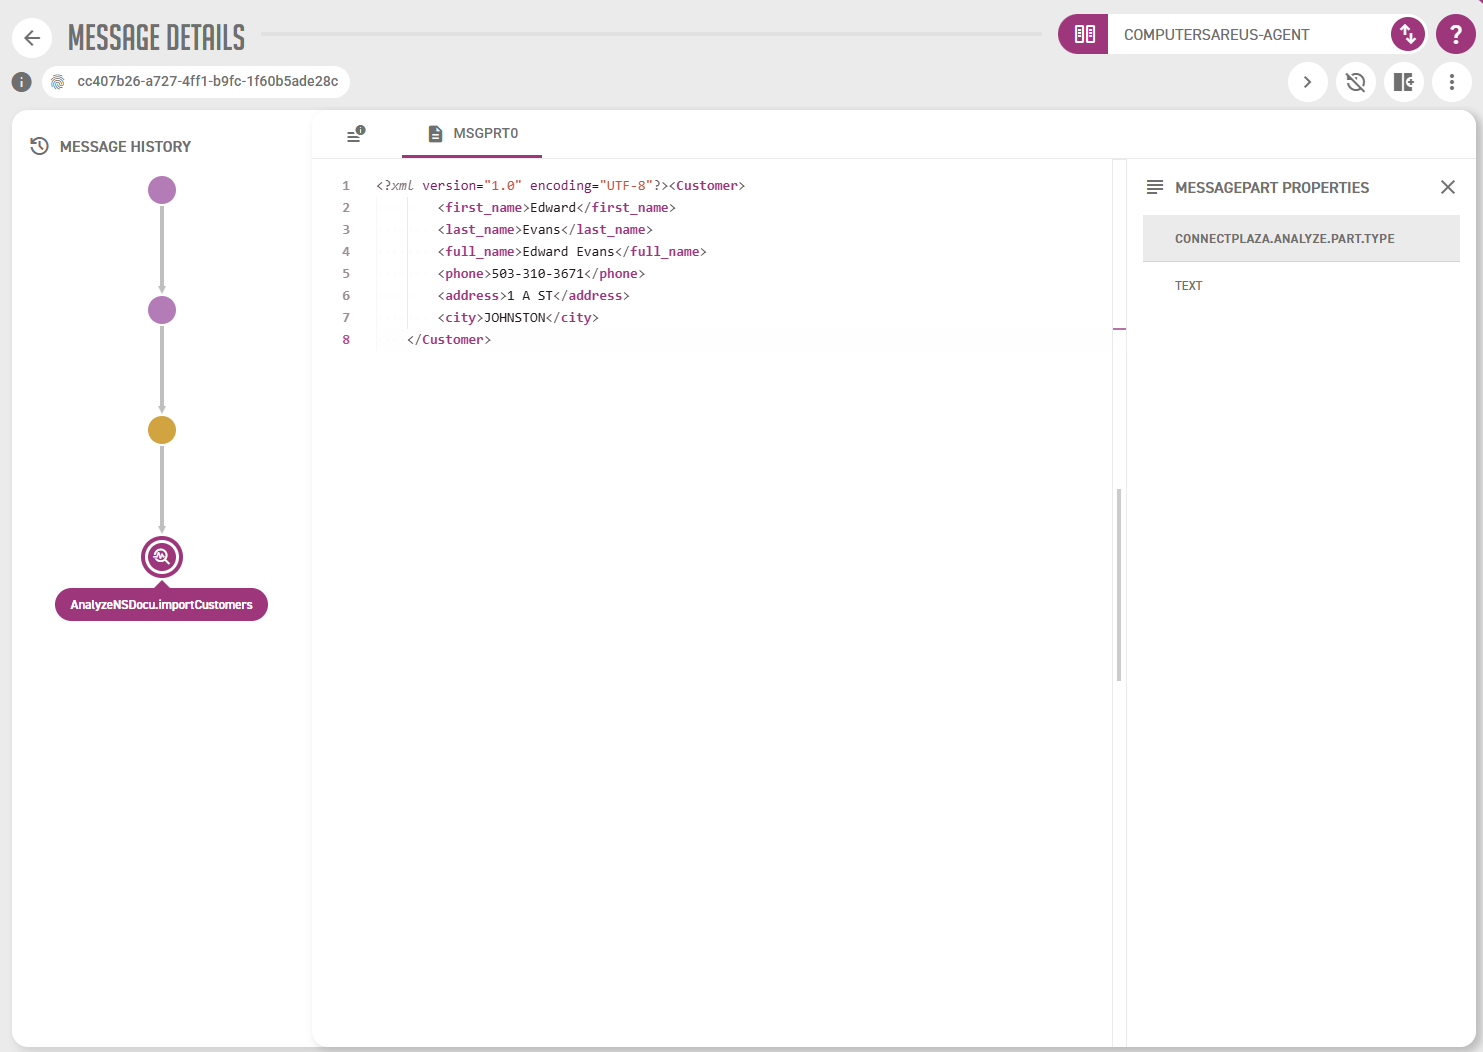
As you probably know, a message part can also have properties. You find them at the info button  . The number on the button is the number of properties available. Click it to open the properties for this message part.
4. Comparing messages
Analyze can show you two messages side by side, which is the quickest way to see what changed between two steps of a flow, or what differs between two runs. To pick messages, open a trace.
Tick the checkbox on each message you want, or use the checkbox in the grid header to select or deselect them all.
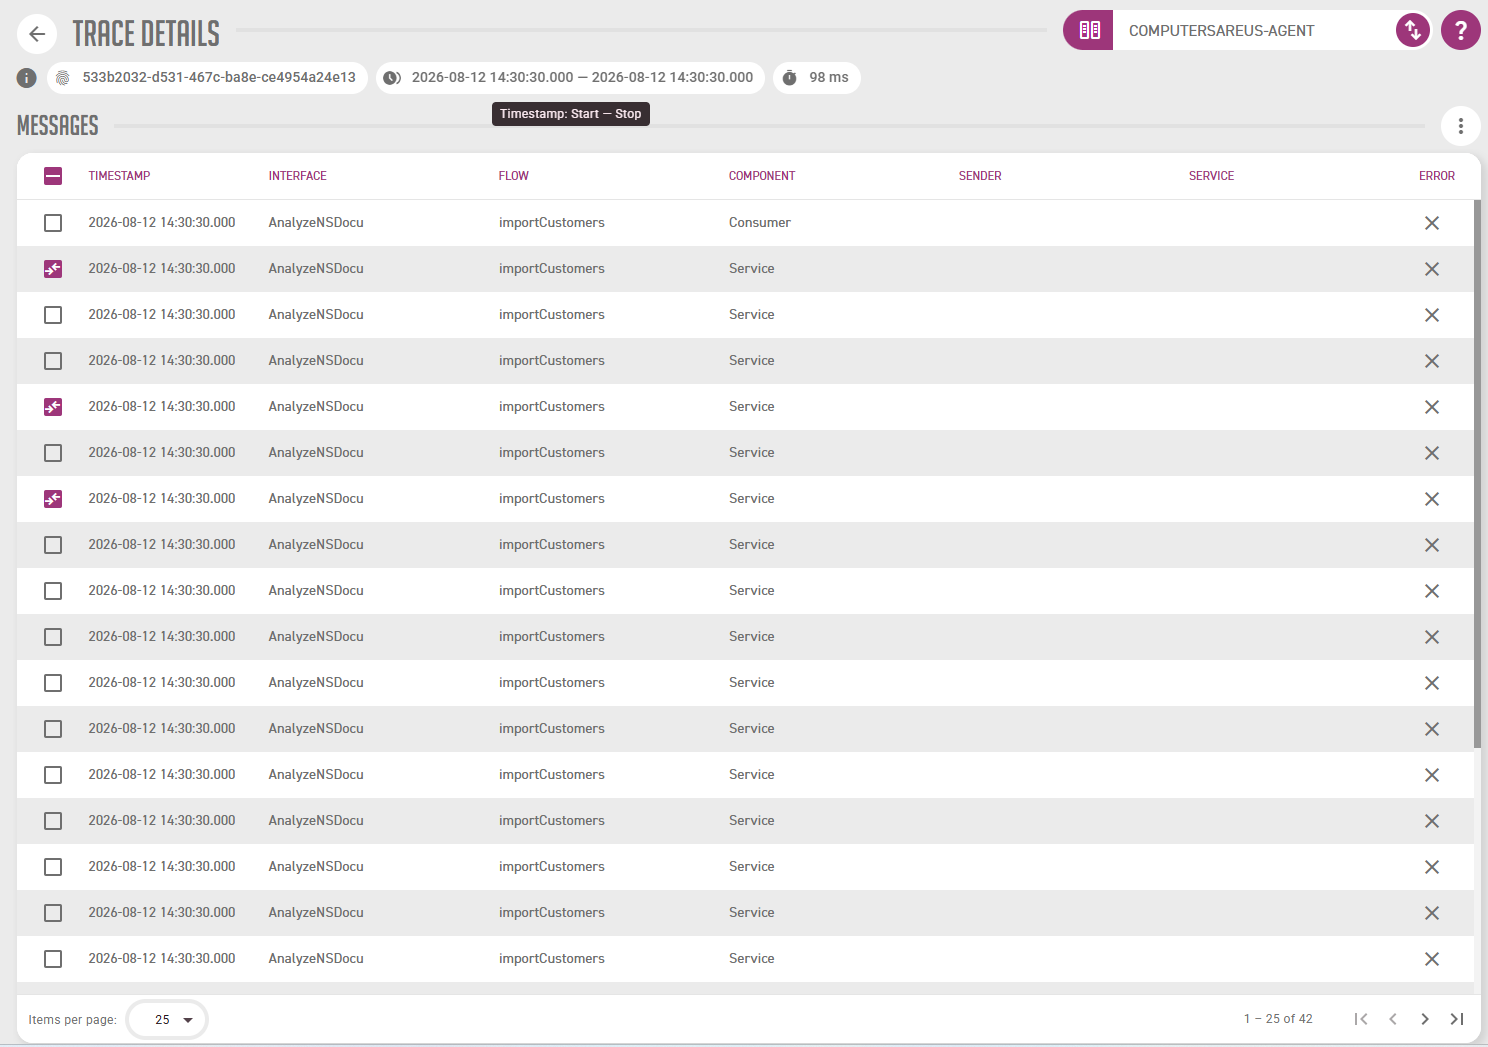
The messages you tick go into a selection that follows you around Analyze; the badge on the Compare Messages menu item shows how many are in it. You can add as many as you like, from more than one trace, and the comparison view then shows any two of them at a time.
|
This same selection feeds the Select Message dropdown when you simulate a pipeline. If that dropdown is empty, it is because nothing has been ticked here yet. See Simulating pipelines. The selection lives in the browser tab. Closing the tab empties it. |
Now go to the compare stage: choose Compare Messages in the menu, or select  at the top right and choose Compare selected.
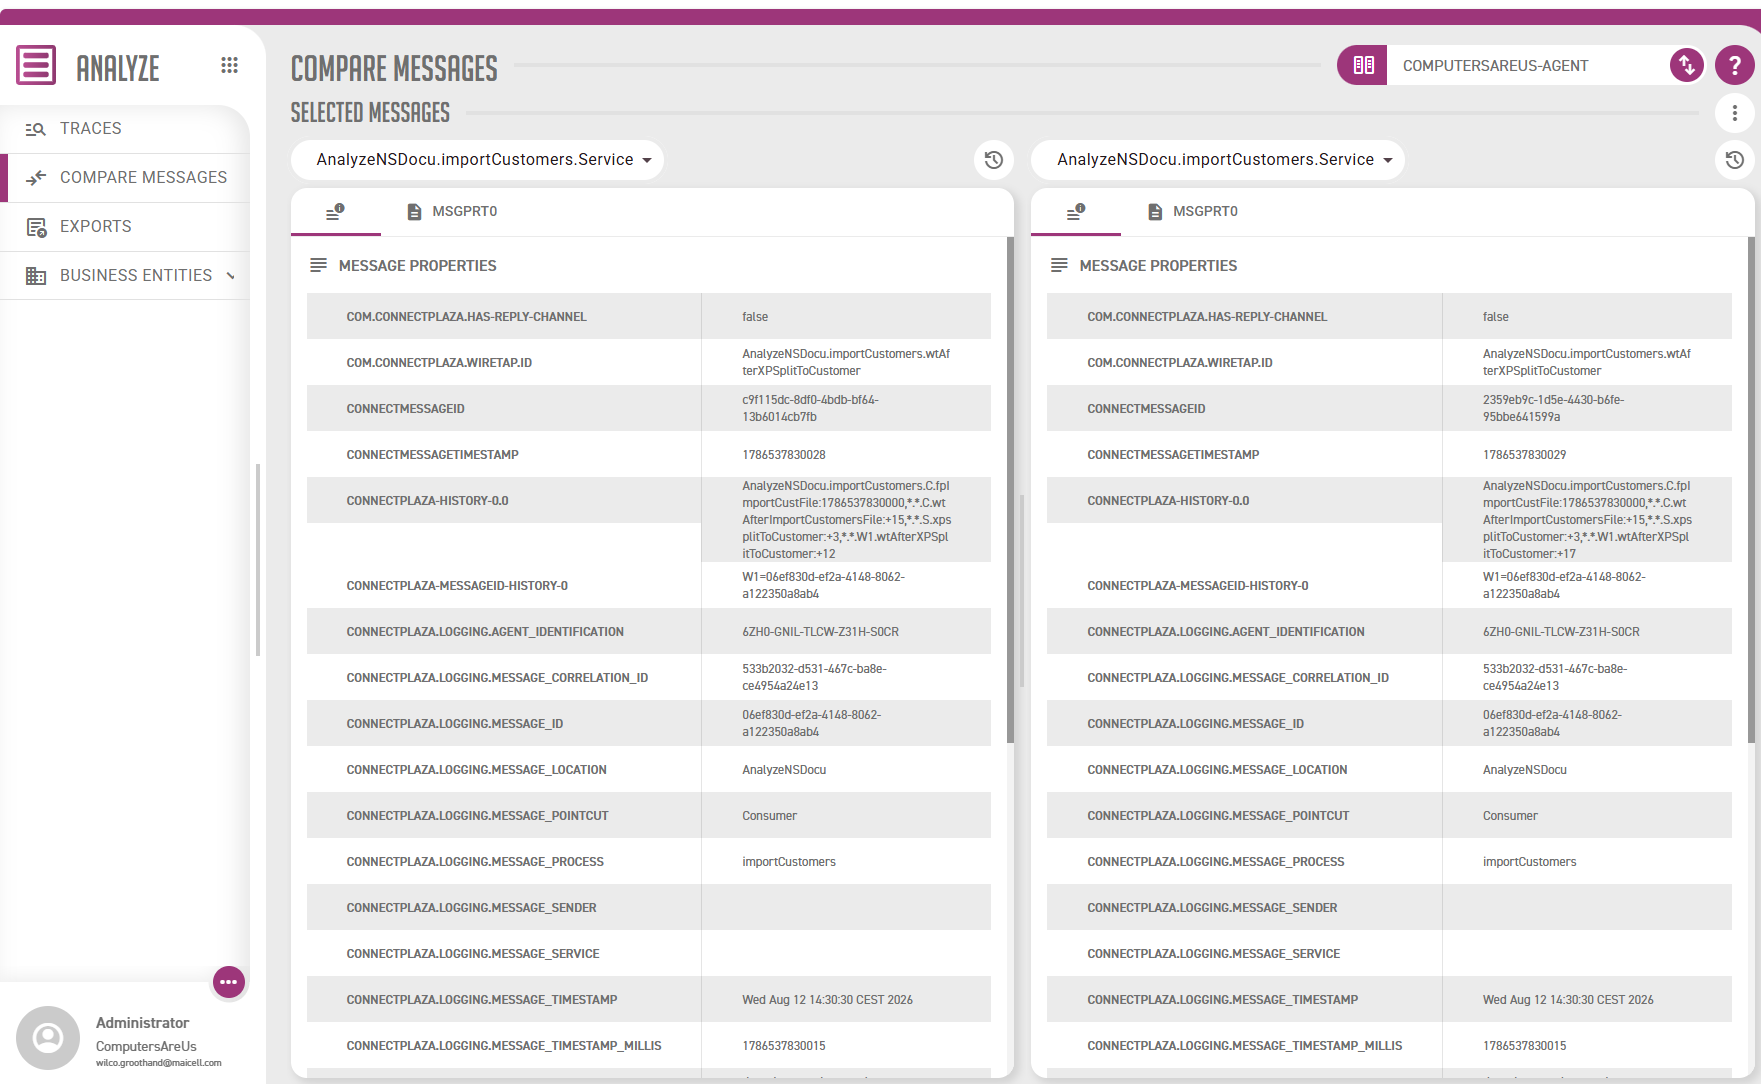
At the right you see again; clicking it offers an option to clear all selected messages.
The rest of the screen is the two messages, side by side. Pick the properties or the parts you want to line up. If you want a timeline, you can open one per message with the  button.
5. Exporting data
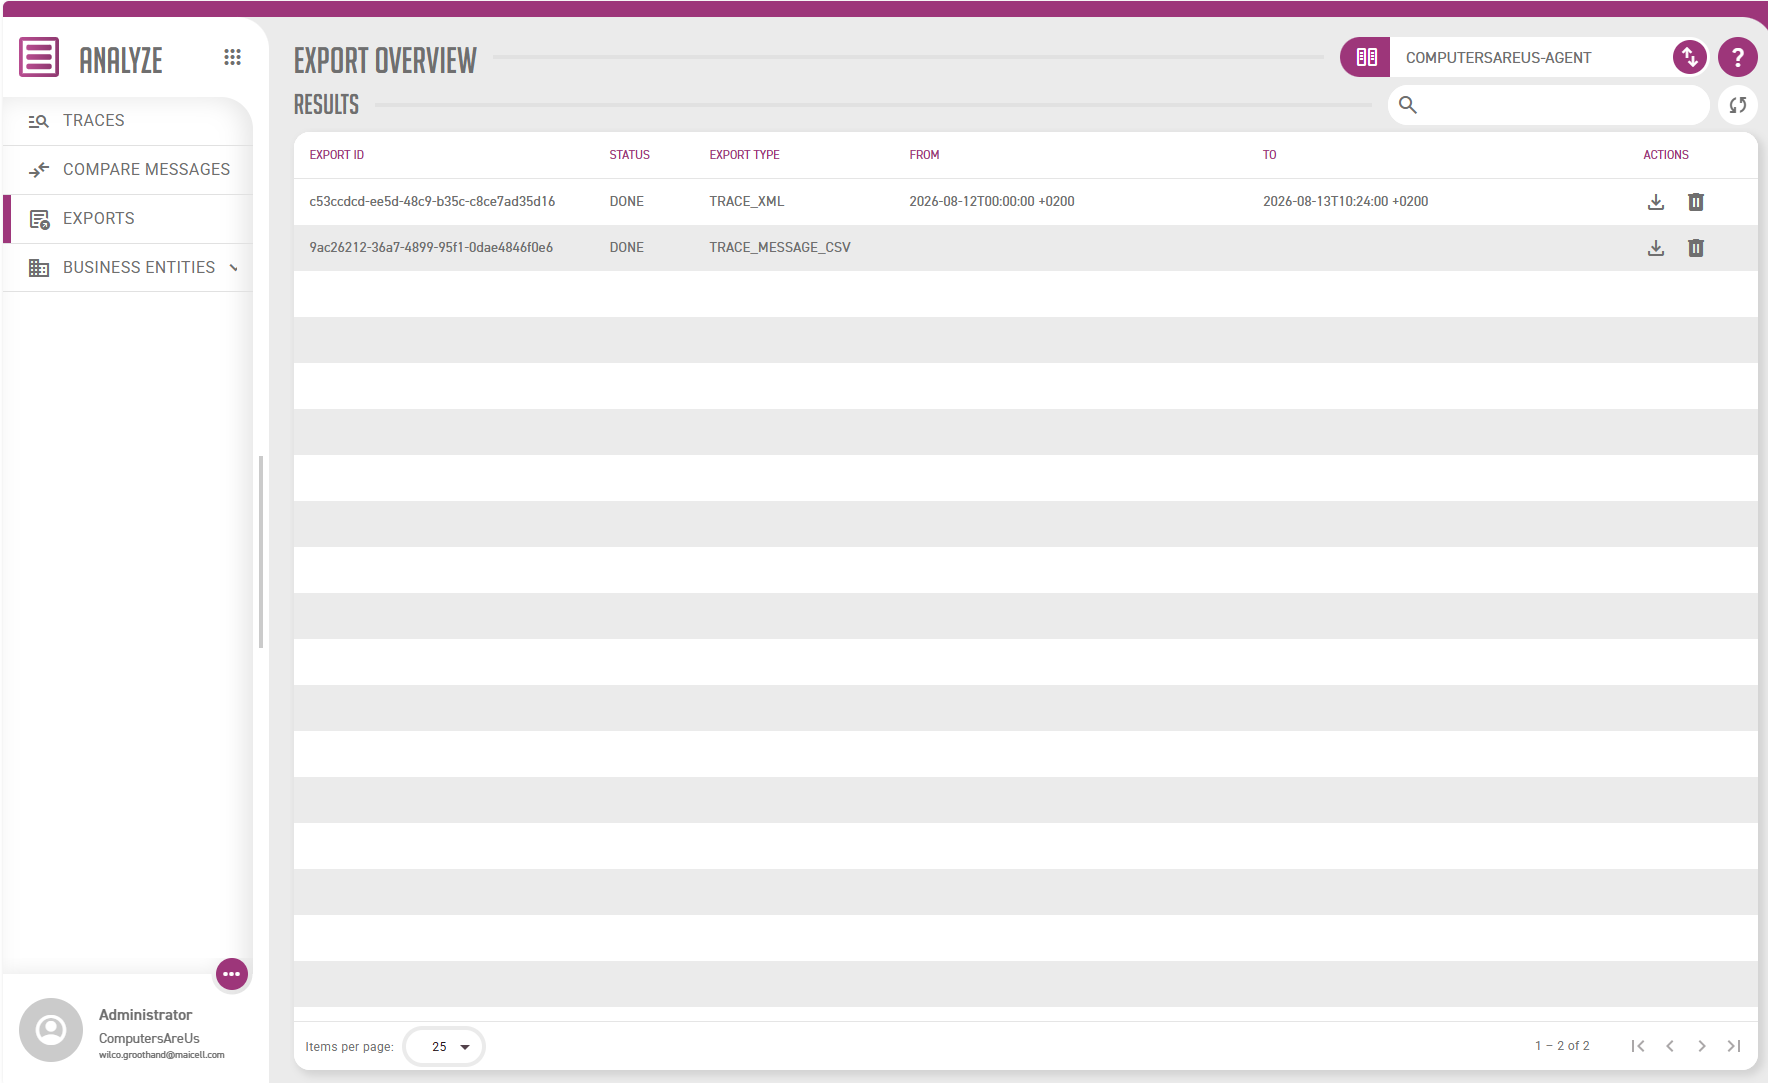
You can export from the trace overview and from the messages inside a trace. In both cases, select and then Export as…, choosing CSV, EXCEL or XML.
The export is prepared in the background, and you are taken to the Exports screen to collect it. The download is a .zip file with your chosen format inside.
| Exporting from | What you get |
|---|---|
The trace overview |
Every trace matching the filters you currently have applied. |
A trace’s message grid |
Every message in that trace. |
|
Exporting messages exports all the messages in the trace, not only the ones you have ticked for comparison. The checkboxes drive the comparison, not the export. |