Analyze
1. Introduction
Analyze is a tool designed to see what is happening within the interfaces you build. If you implement the Analyze Wiretap component, the message is automatically registered in the Analyze database.
How does this work?
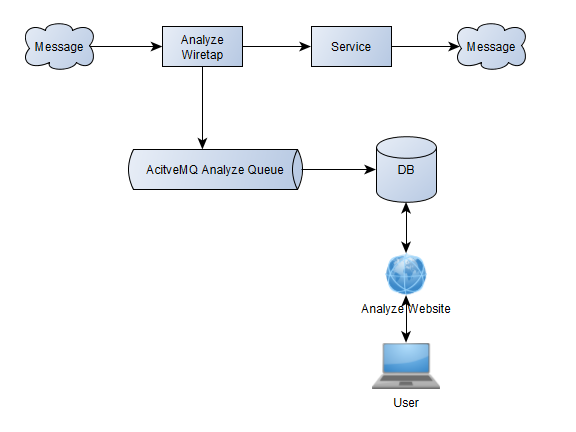
A message reaches the Analyze Wiretap component, which copies it onto an ActiveMQ queue. That copy is made on the flow thread itself, so it costs your flow the time it takes to copy the message. Everything after it does not: the queue is drained separately and written to the database you configured, and you see the result in the Analyze screens. A storage problem also cannot fail your message. If the queue is full or the write fails, the wiretap logs the failure and the message carries on through your flow.
2. Start with Analyze
Log into your ConnectPlaza® environment and select the Analyze tab. Analyze always works against one agent at a time, so the first screen you see is Agent Selection.
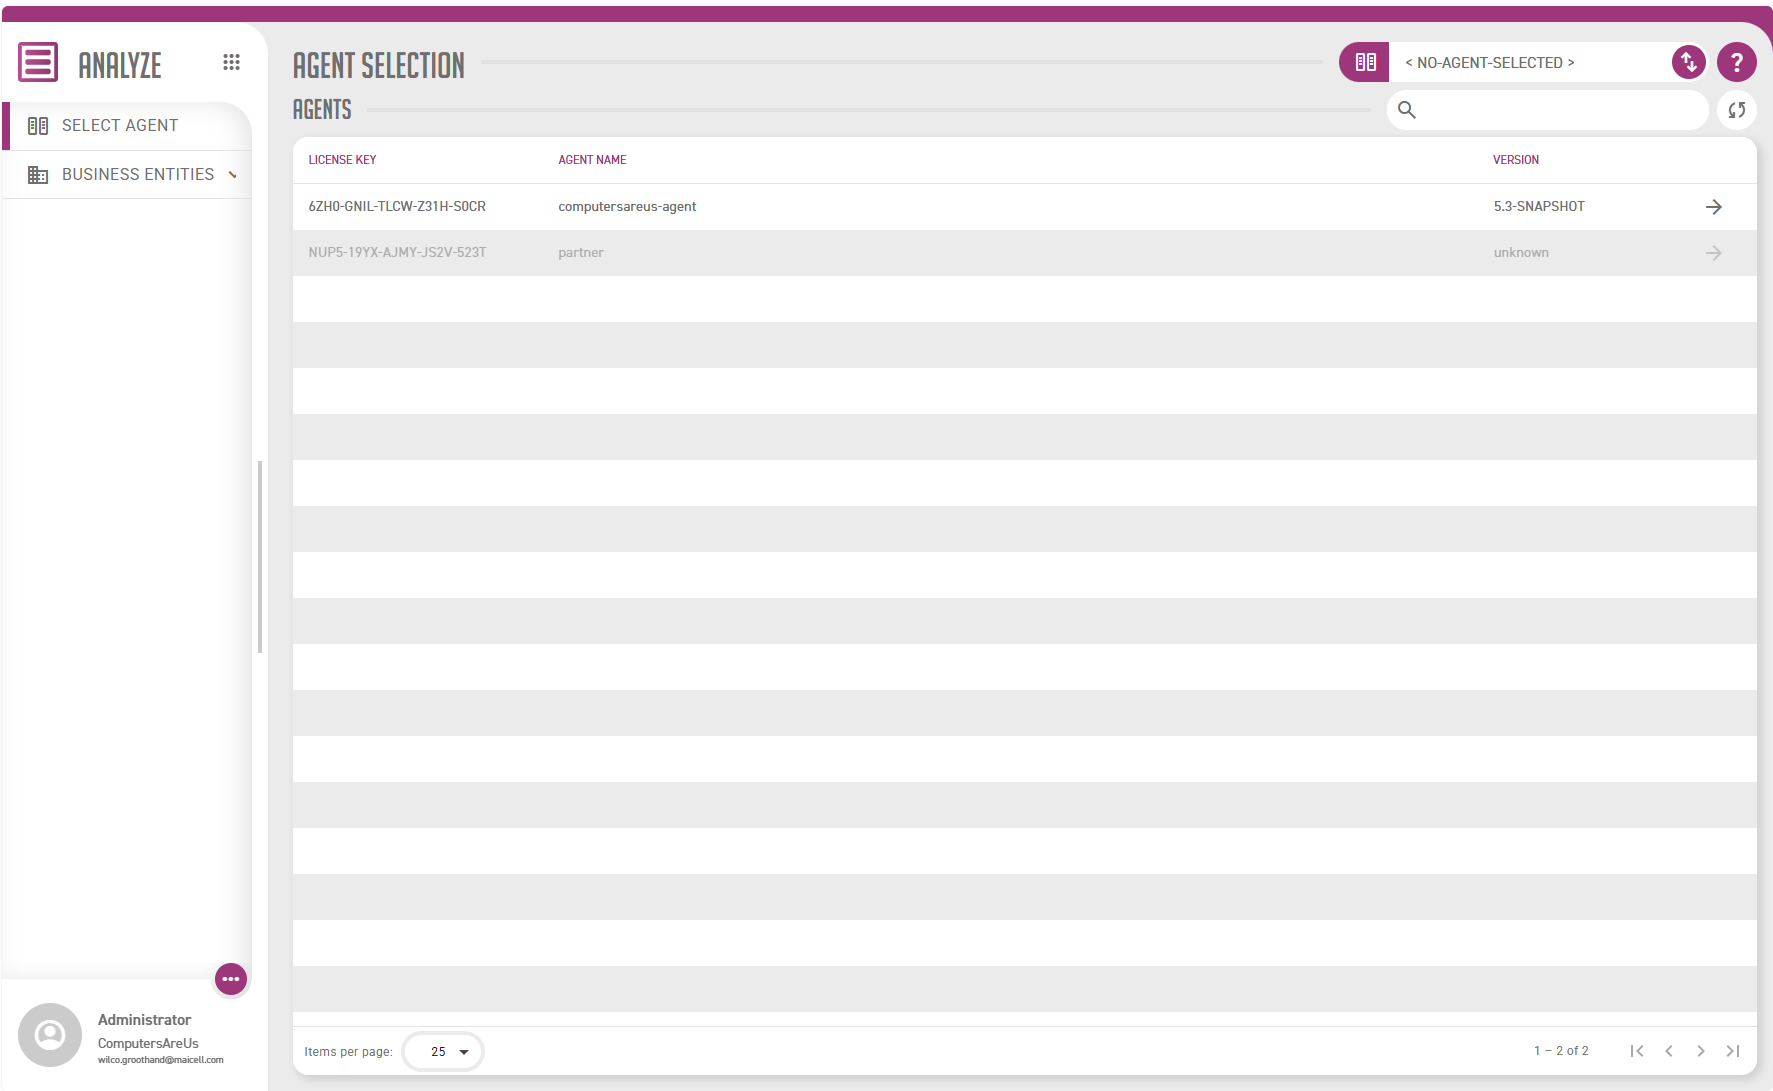
Double-click the row for your agent, or select the arrow  at the end of it.
|
The arrow is disabled for an agent that is not currently connected. This screen is the one place that shows you which of your agents Analyze can reach. |
After you select your agent, the following screen appears.
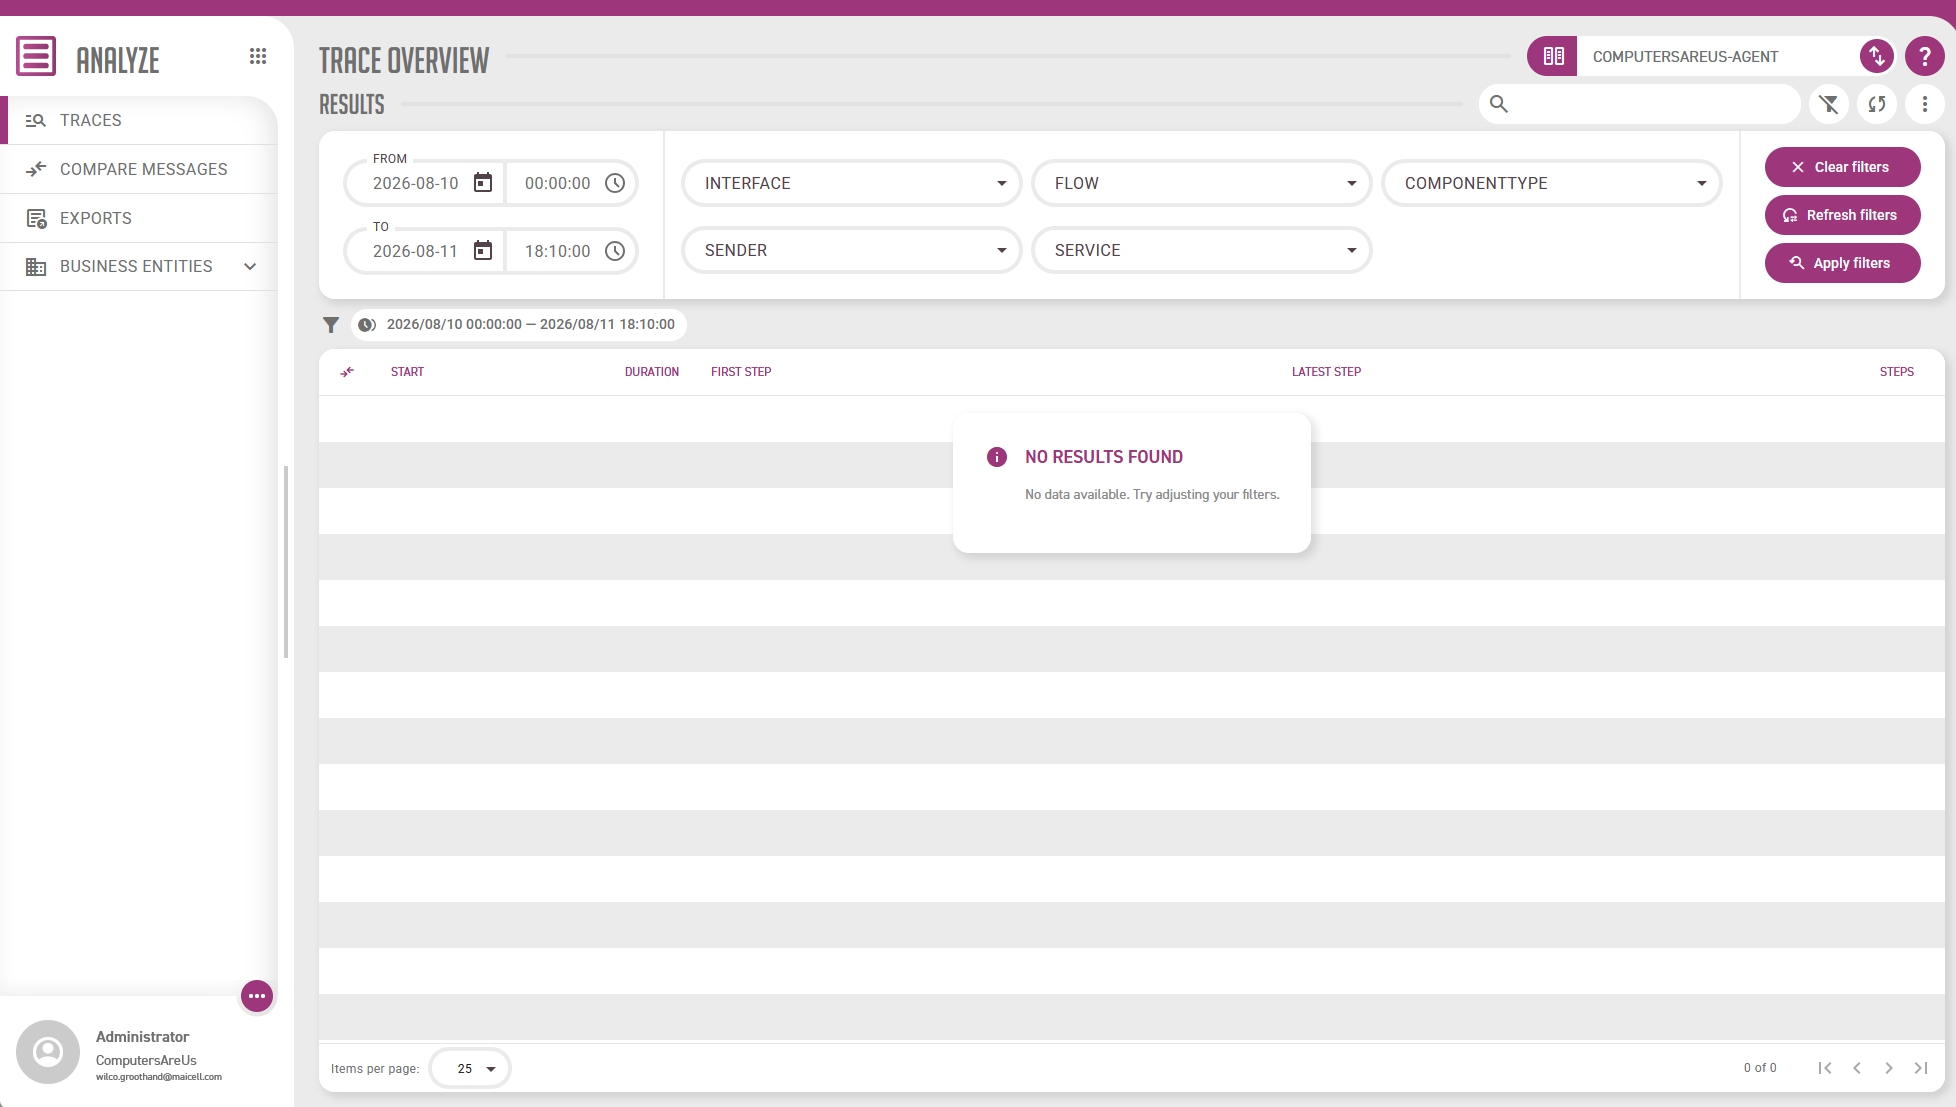
You can switch to another agent at any time using the agent name in the upper corner of the screen. 
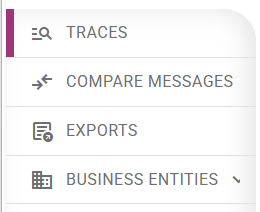
Analyze opens on the Trace overview. The side menu offers the other ways of looking at the same traffic.
-
Traces - every message the Analyze Wiretaps stored, newest first.
-
Compare Messages - the messages you have picked out to compare side by side. The badge shows how many are currently selected.
-
Exports - the export files you have requested, ready to download.
-
Business entities - a group holding Overview, Definitions, Pipelines, Agent Mappings and Deployments.
Traces are representations of the raw data of your messages, as the Analyze Wiretaps recorded it. Business entities are a different view of the same traffic: the business meaning extracted from it. Which one you want depends on the question you are asking, and Analyze concepts explains the difference and the model behind it.
The Business entities screens are described from Business entities onwards. Traces, message details and comparing are described in Traces, messages and comparing.
At the bottom of the menu you see your account details. Press  to open a drop down menu, where you can reach your account settings or select Sign out.
3. Settings
You also see some buttons at the top right of the screen, including a search box.
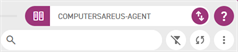
These controls are on every Analyze screen.
| Button | Description |
|---|---|
|
Switch selected agent. Every Analyze screen belongs to one agent, so changing it here reloads the screen against the other agent’s data. |
|
More actions, which offers Export as… to export as CSV, EXCEL or XML. What is exported follows the filters that are applied, not any selection you made: on the Trace overview you get the traces the current filters return, and inside a trace you get all of that trace’s messages. The export is prepared in the background and collected from the Exports screen as a |
|
Refresh results. Re-runs the current query and reloads the rows, using the filters that are already applied. Use it to pick up messages that arrived since you last searched. |
|
Go to documentation, which opens these pages. |
|
Toggle filters, which shows or hides the filter panel. The selected From and To dates stay visible above the results either way |
|
Filters the rows that are already loaded on screen, as you type. It is not a database search: rows on other pages, and rows outside the date window, are never matched. To search the stored data, use the filter panel and press Apply filters. |




|
Refresh results in this toolbar is not the same control as Refresh filters in the filter panel. Refresh results reloads the rows; Refresh filters reloads the values offered in the filter dropdowns. See Filter options. |
4. Filter options
The results on screen can be filtered. Make sure the filter toggle is on, so that you can see the filter options.

Every dropdown below is filled from the values your Analyze database has actually seen, so a name only appears once a message has passed through it.
| Field(s) | Description |
|---|---|
|
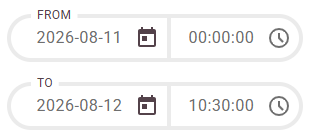
The start and end of the period to search. Both the date and the time can be picked from a calendar or a clock, or typed in directly. |
Interface |
The interface the message passed through. |
Flow |
The flow within that interface. |
ComponentType |
Which wiretap point recorded the message. The Business entities overview calls this same dimension Wiretap. |
Sender |
The Sender configured on the Analyze Wiretap component. Set it in Constructor if you want to filter on it. |
Service |
The Service configured on the Analyze Wiretap component, likewise. |
4.1. Applying, clearing and refreshing
Three buttons sit under the filter fields, and they do not do what their names might suggest.
| Button | What it does |
|---|---|
Apply filters |
Runs the search. Nothing you change in the panel affects the results until you press this, and pressing it always runs the query again, even when you have changed nothing. |
Clear filters |
Empties the Interface, Flow, ComponentType, Sender and Service fields and removes the chips above the results. It leaves the From and To dates untouched, and it does not re-run the search, so the grid keeps showing the previous query’s rows until you press Apply filters. |
Refresh filters |
Reloads the values offered in the dropdowns. Use it when a newly deployed flow or a new sender is missing from a list. It does not touch the results. |
Above the results you see a chip for each filter that is in force. The chips describe the query that was run, not what the panel currently shows, so if the two disagree it means you have changed the panel and not yet pressed Apply filters. Clear filters is the one case where the chips go away before the grid does: the chips disappear immediately while the rows below them are still the previous query’s.
An empty result grid is far more often the date window than a missing message. Because From starts at yesterday 00:00, anything older falls outside the search. Widen From and press Apply filters before concluding a message was never recorded.
5. The result set

| Field | Description |
|---|---|
|
The number of messages in this trace that you have selected for comparison. The badge appears only when at least one is selected. |
Start |
Start time of the trace |
Duration |
Total duration time of the complete flow |
First step |
First step (wiretap) in the flow |
Latest step |
Last step (wiretap) in the flow |
Steps |
Total steps (wiretaps) in the flow |
Items per page |
The selection box to select the number of items per page |